
- There are fundamental differences when investing into closed-ended private market funds compared to public equivalents and investors need to be aware of the unique way these funds are distributed
- Private market funds are illiquid and their return profile follows a so-called J-Curve which is the tendency to post negative returns in the initial years followed by positive returns in later years when the investments mature and start returning cash
- Analysing the J-Curve will allow investors to plan for their liquidity requirements and help them to predict when they are likely to see a positive return on their initial investments
- Understanding both the J-Curve and the four key stages in the waterfall distribution is important not only to evaluate fees and expenses, but to ensure both manager and investor incentives are equally aligned
Last year, we published a series of introductory articles highlighting the potential benefits of investing in the private markets, especially in times of economic turbulence where the asset class has historically outperformed its public markets equivalent1. Having outlined the benefits, we now wanted to fully explain the cash flow dynamics, break down the cost of investing in this asset class as well as outline the key factors investors should be aware of before committing capital.
Illiquidity in exchange for control
Firstly, it must be noted that investing in private market funds is a completely different process to public market equivalents which significantly impacts when investors may expect to see returns from their investments. Two key differences are in the timing and amount of cash outlays, both on the way in and out.
Two key differences are in the timing and amount of cash outlays, both on the way in and out.
In public markets, individual investors and fund managers can typically buy public securities (stocks, bonds, indeces) by investing 100% of the cash upfront, which means their capital is deployed from Day 1. If and when they want to exit their investment, whether due to market conditions changing or the investment thesis no longer being valid, investors can relatively easily sell their investment on the same exchange. There is a trade-off involved: the investor rarely ever owns a controlling majority of a public business, or has the ability to intervene in its management and influence its value creation plan, but in exchange can usually exit the investment easily.
In private markets, managers invest out of a pooled fund over time, and typically aim for a controlling stake to execute a value creation plan and sell the business for a higher price, by virtue of it being more valuable as a result. Identifying, bidding for and ultimately acquiring a controlling stake in a business takes time (months, and sometimes even years), and therefore a private market fund’s (and therefore investors’) cash is typically never 100% deployed upfront. Exits also happen in a staggered manner, as portfolio companies go through a sale process. In short, private fund managers create a portfolio and invest capital over time, subsequently generating and distributing any returns for their investors over a longer period.
The ingredients of the illiquidity premium (and the lesser correlation to public markets) – i.e. features that make private markets funds an attractive investment to certain investors – are a more staggered deployment and exit period in exchange for control to execute a value creation plan.
In summary, the main reason investors should be prepared to be patient to receive their returns is that once General Partners (GPs) have created their portfolios, an important stage of the investment lifecycle is value creation – a crucial period where GPs can earn their management fees (we’ll come onto that shortly!) and utilise all their experience and market expertise to deploy an array of strategies, all aimed at essentially creating significant value in their portfolios. This stage can typically last between 4-6 years to allow GPs to execute their strategies and realise their investments, so in short Limited Partners (LPs) are required to have patience as traditionally there are no early withdrawals in this asset class.
What fees are involved?
Typically, there are two main types of fees investors should be very familiar with when committing capital into private market funds: management and performance fees.
Management fees are typically paid on an annual basis and are intended to meet all expenses GPs encounter when actively managing their portfolios, including the basics such as salaries, office space etc. These fees are generally a percentage of the investors’ committed capital and can range between 1% to 2.5%, throughout the fund’s investment period which usually lasts between 3-5 years. After this period, the fees are significantly reduced placing pressure on the GPs to execute their value creation strategies and exit the investments.
While management fees allow GPs to effectively manage their investments, it’s the performance fees which help to incentivise their performance. A performance fee (also known as ‘carried interest’, or ‘carry’) is a share of the profits which tends to be at 20% for GPs, as long as they pass the initial hurdle rate (also called ‘preferred return’) which is typically set at 8% on an annual basis. The hurdle rate is designed to closely align the interests of both LPs and GPs, incentivising the latter to generate attractive returns in order to gain a share of the profits. If GPs fall below that initial hurdle rate, they will fail to receive a performance fee.
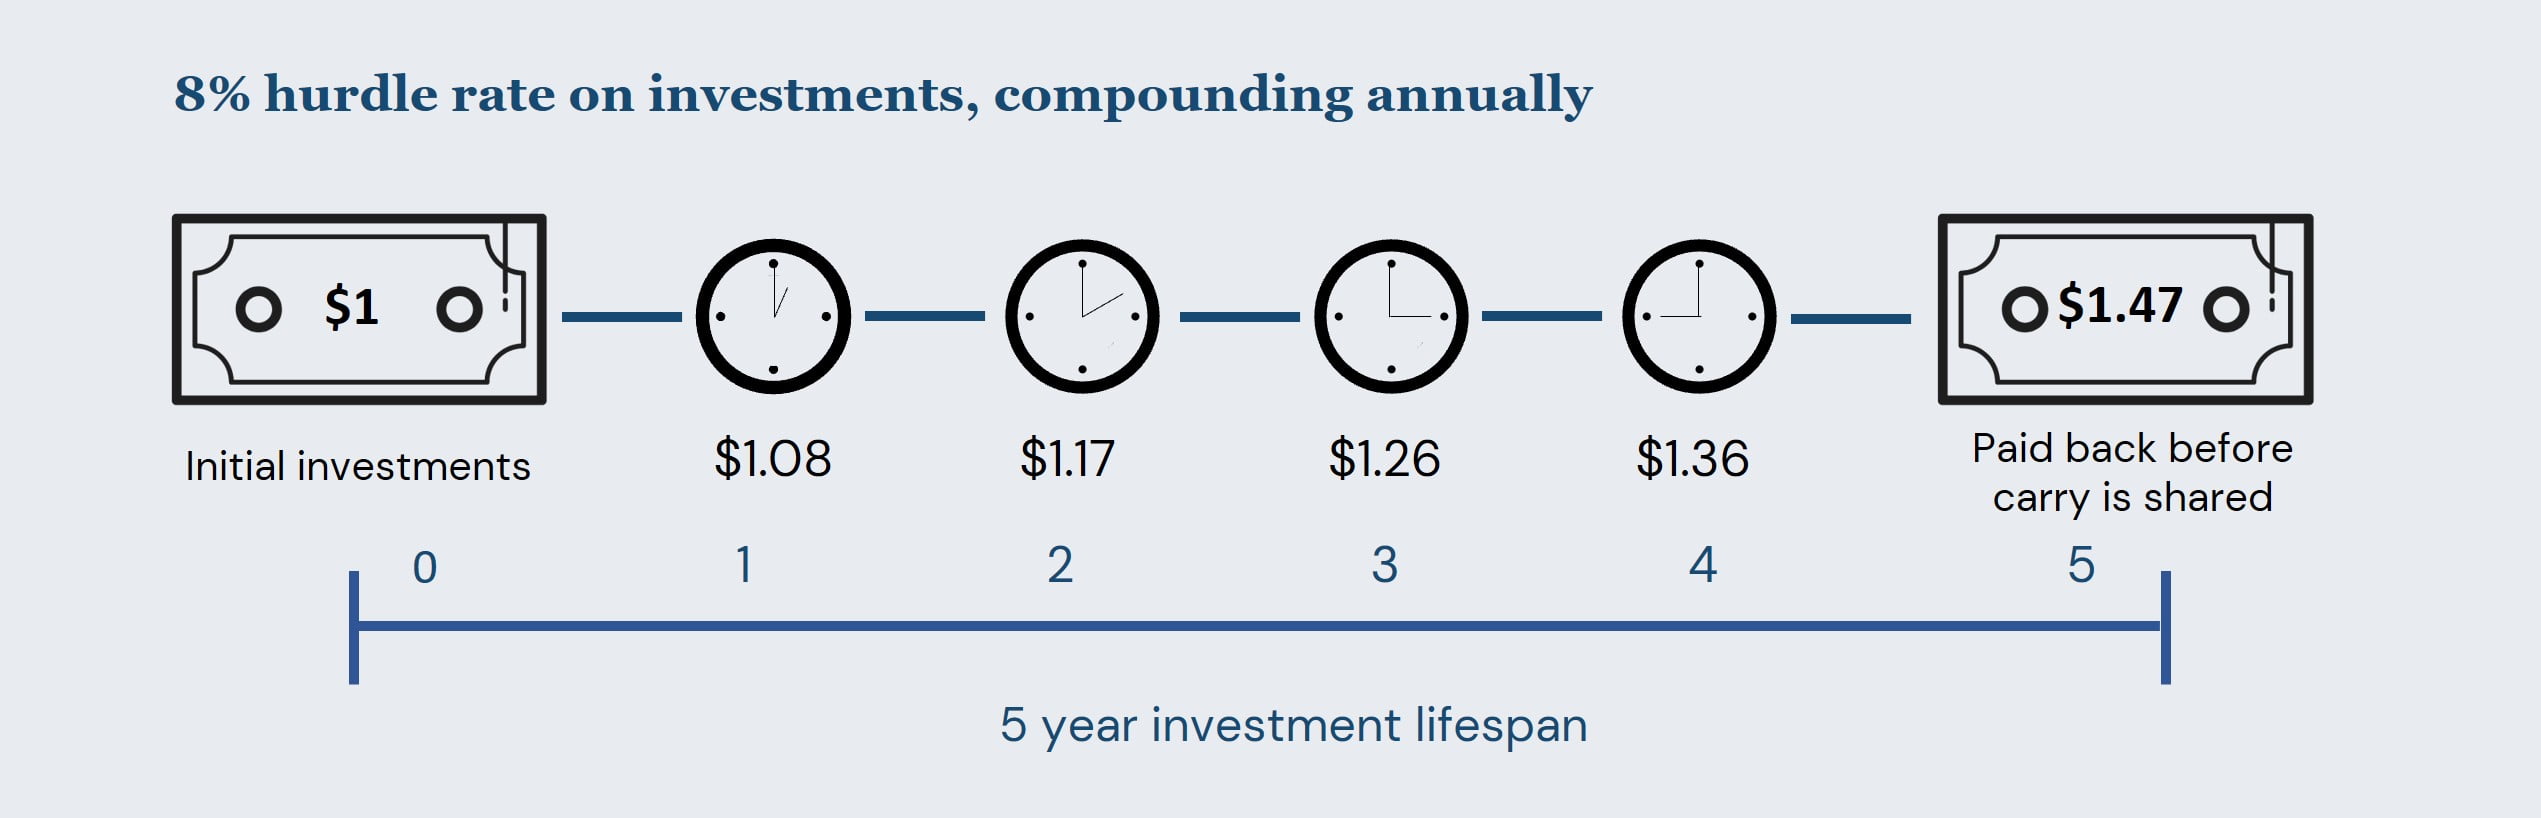
Figure 12 below illustrates how performance fees work in practice. We can see that at the end of an investment lifecycle, GPs must pay LPs the hurdle rate at 8% p.a. before they begin to qualify for performance fees.
Understanding the J-Curve
For an investor to fully comprehend their commitments and how the fund manager distributes returns, the ‘J-Curve’ effect is often cited.
Figure 2: Illustrative example of private market fund cash flows3
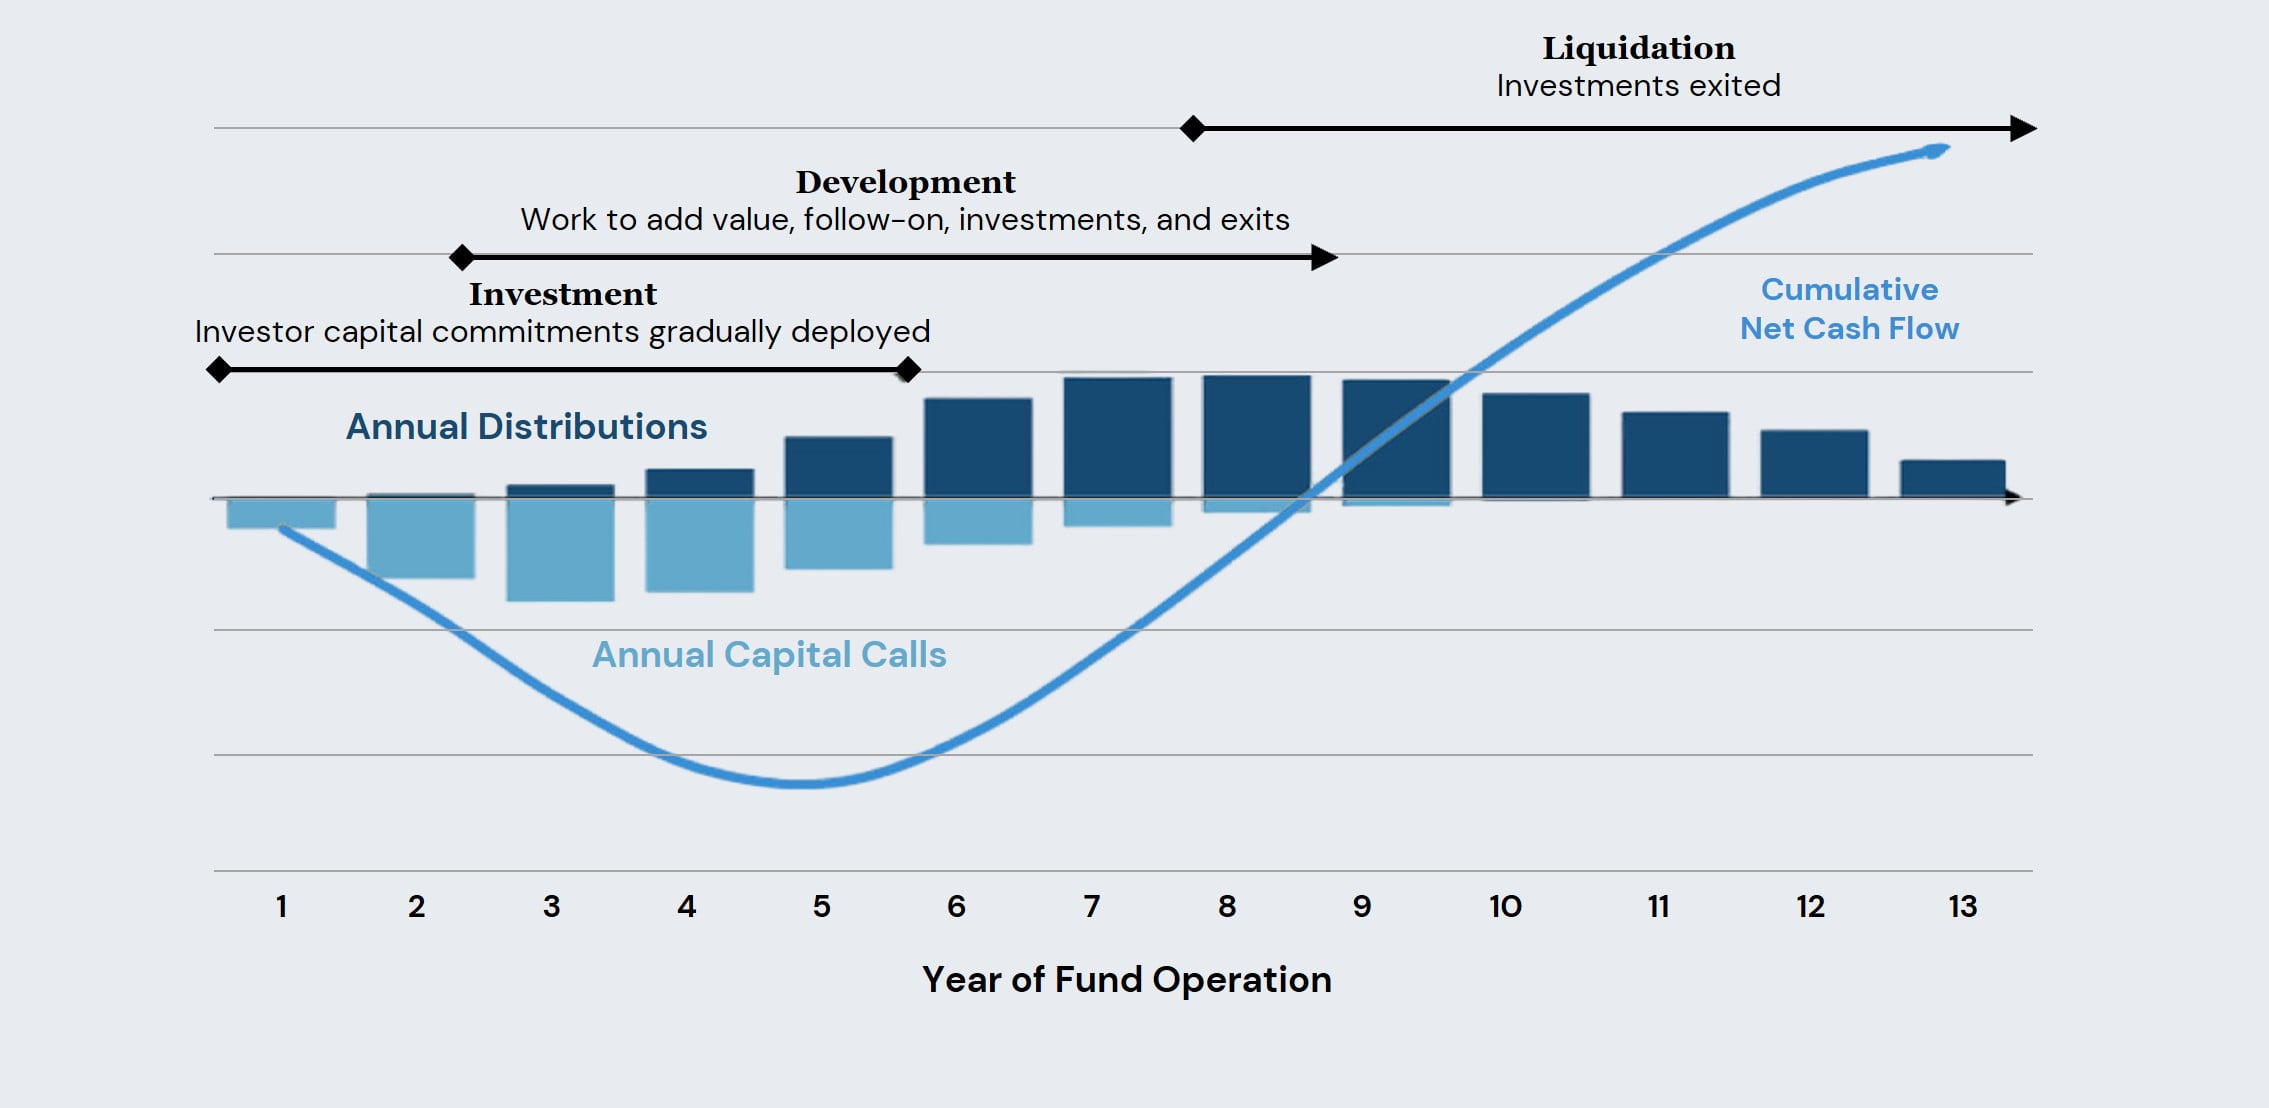
Source: HarbourVest. For illustrative purposes only. Intended to demonstrate the mechanics and cash flows of a private equity fund. It is not intended to predict the performance or cash flows of any specific fund and should not be construed as predicting the future. The actual pace and timing of cash flows of a private equity fund are highly dependent on the fund’s investment pace, the types of investments made by the fund, and market conditions. Private equity investing involves significant risks, including loss of the entire investment.
As we can see in Figure 23 above, typically it takes 3 to 5 years to deploy the bulk of the fund with the option of making capital calls in the post-investment period to support portfolio companies. On the return side, some early successes can potentially start returning capital as early as Year 3, but the majority of the distributions will happen between years 6 to 9.
In summary, as time passes and GPs begin to realise their portfolio investments, returns have the potential to significantly improve as the annualised hurdle rate is first repaid before distributing earnings, thus creating a ‘J-Curve’ effect.
The distribution waterfall
Once the time comes to return capital, there is a
pecking order, commonly referred to as the distribution waterfall, which is
usually specified in the limited partnership agreement.
Figure 3: The distribution waterfall and performance fees4
Sequence of distributions from a private market fund with a catch-up agreement
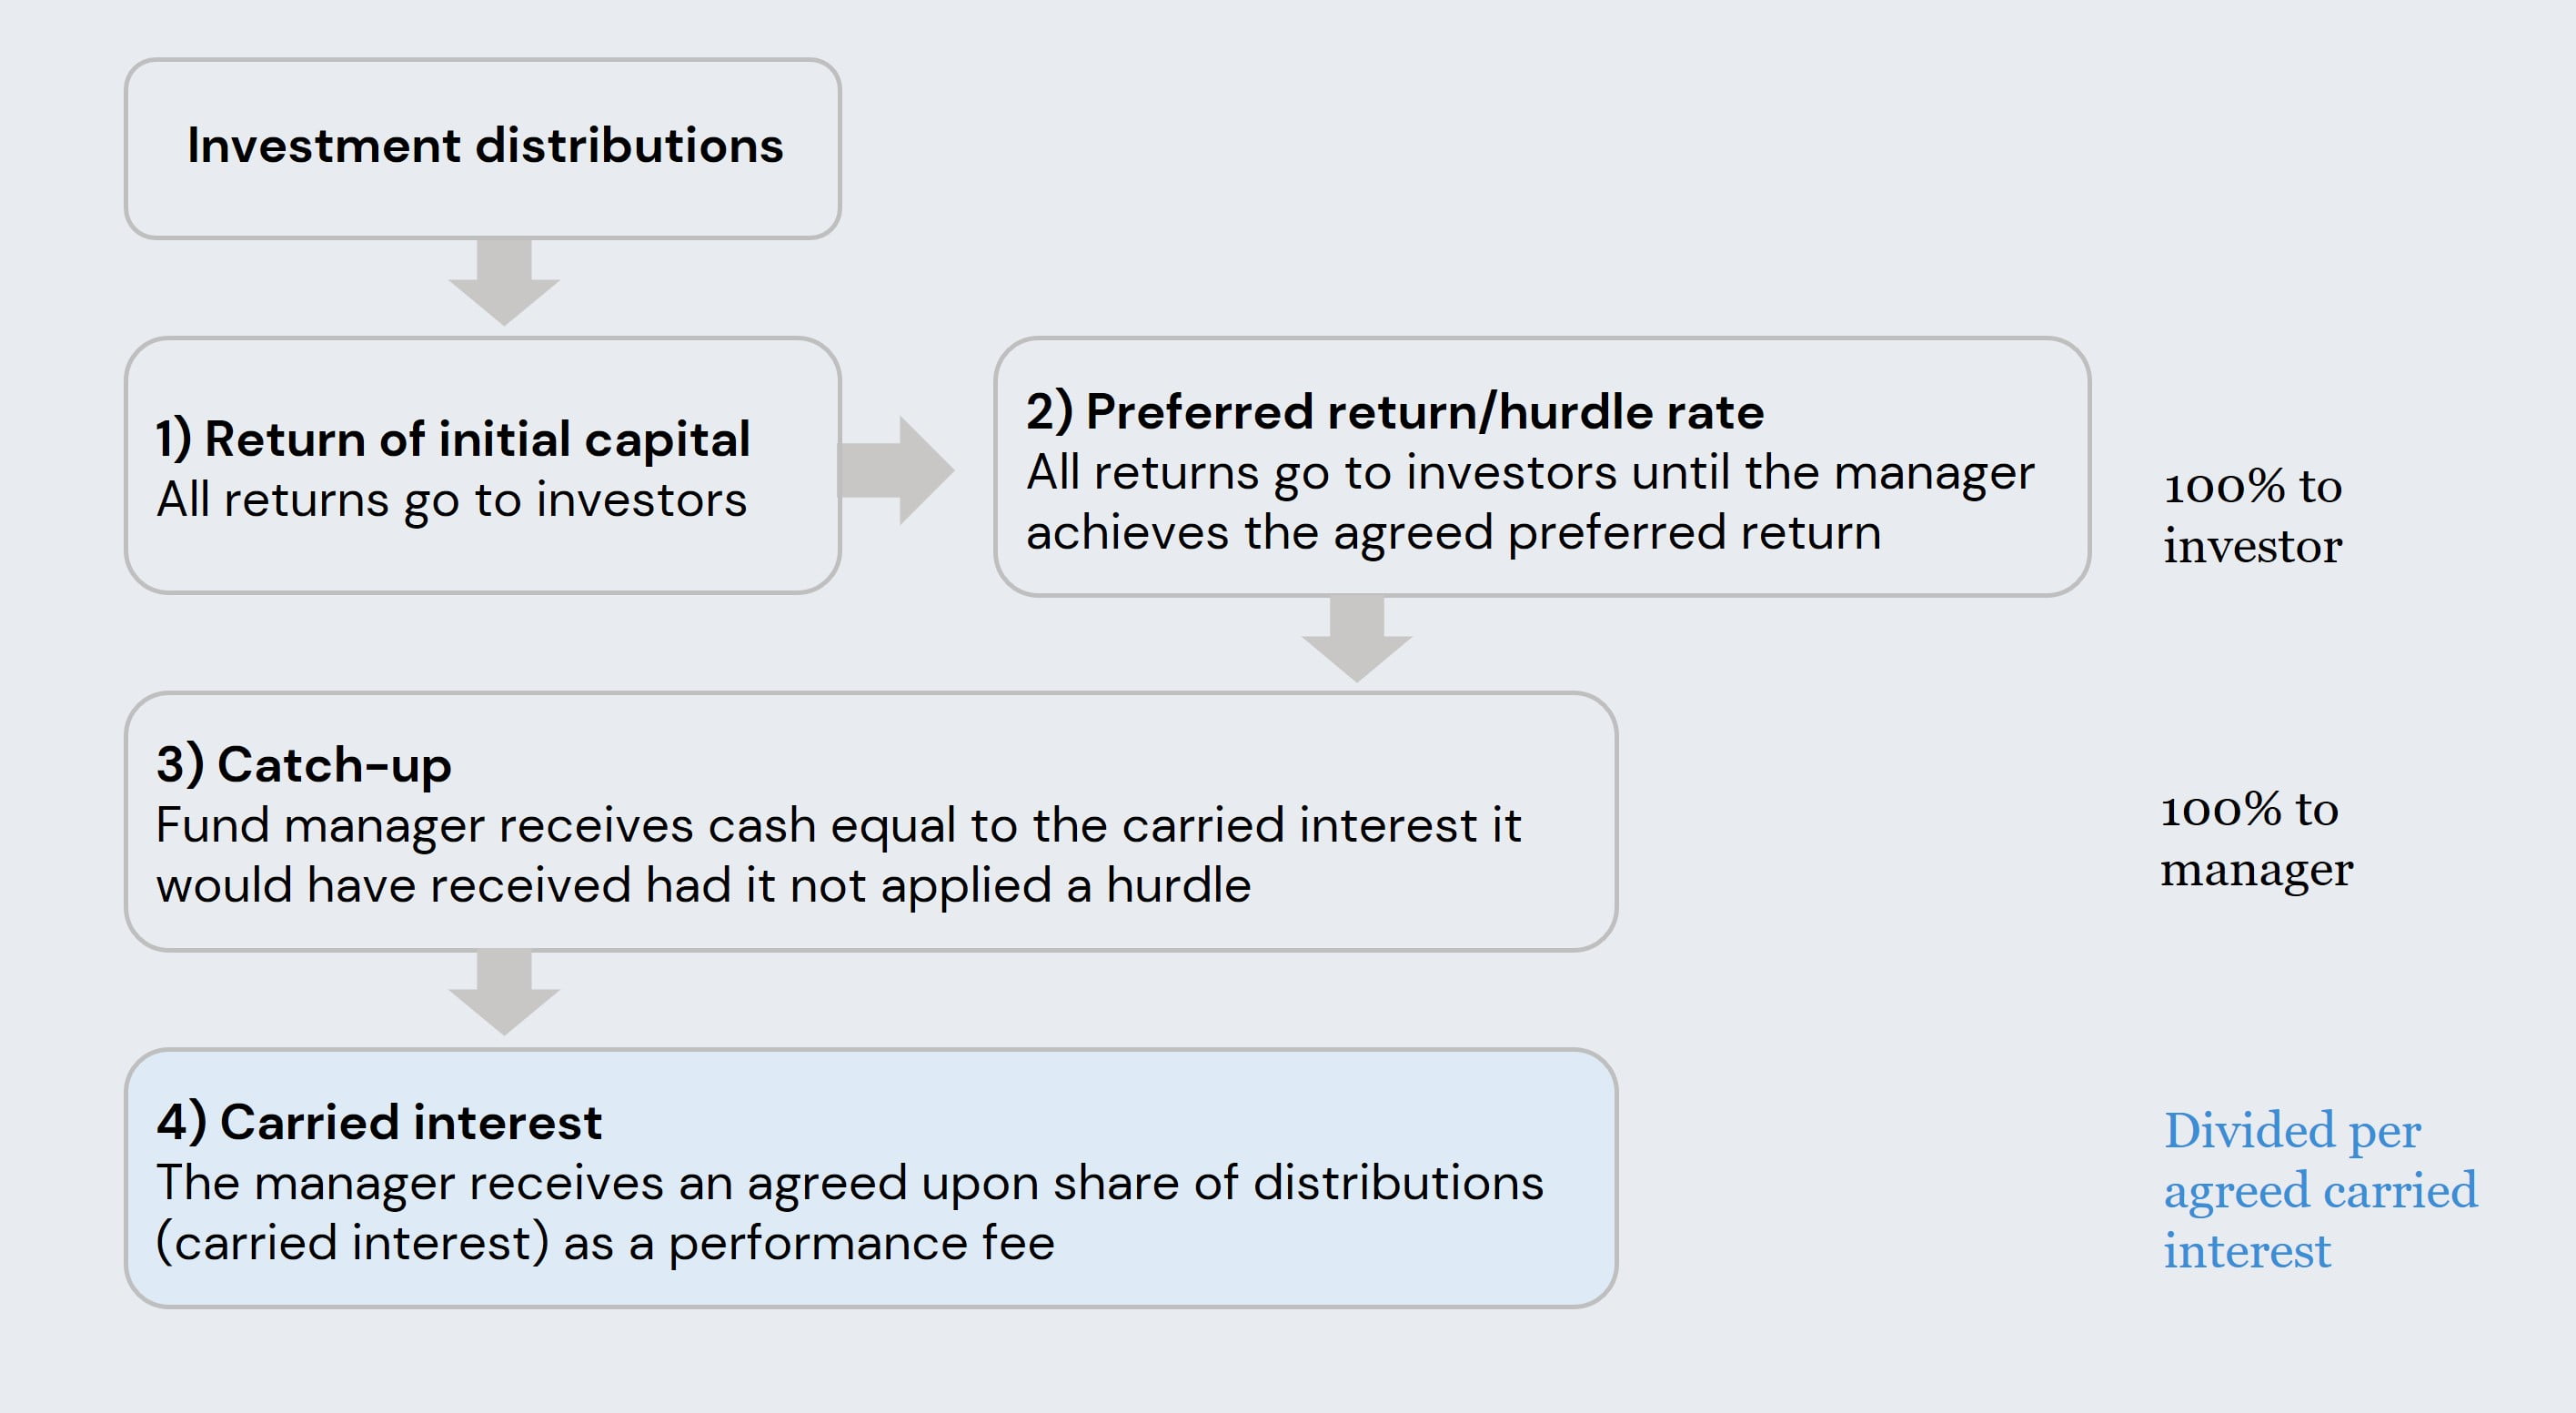
Source: HarbourVest. For illustrative purposes only.
As we can see from Figure 34 above, there are 4 main phases of a distribution waterfall.
1. Returning all initial capital invested by the LPs at the beginning of the investment process.
2. All distributions go to LPs until they receive the pre-agreed ‘preferred return’ (or as we mentioned previously, hurdle rate).
3. Once all initial capital has been returned and the hurdle rate has been met, the fund manager qualifies to receive a ‘catch-up’ which is in essence a sum of cash equal to the carried interest the GP would have received if the hurdle rate was removed.
4. Lastly, the carried interest will then be divided as per the initial agreement which is usually 80/20 in the LPs favour.
Interestingly, Figure 45 further explains this concept by looking at the difference in returns for both LPs and GPs when the hurdle rate has only just been met vs. a more successful investment when the GP has surpassed the hurdle rate, therefore qualifying for performance fees and greater returns.
Figure 4: Illustration of performance fee application for a hypothetical $1 investment5
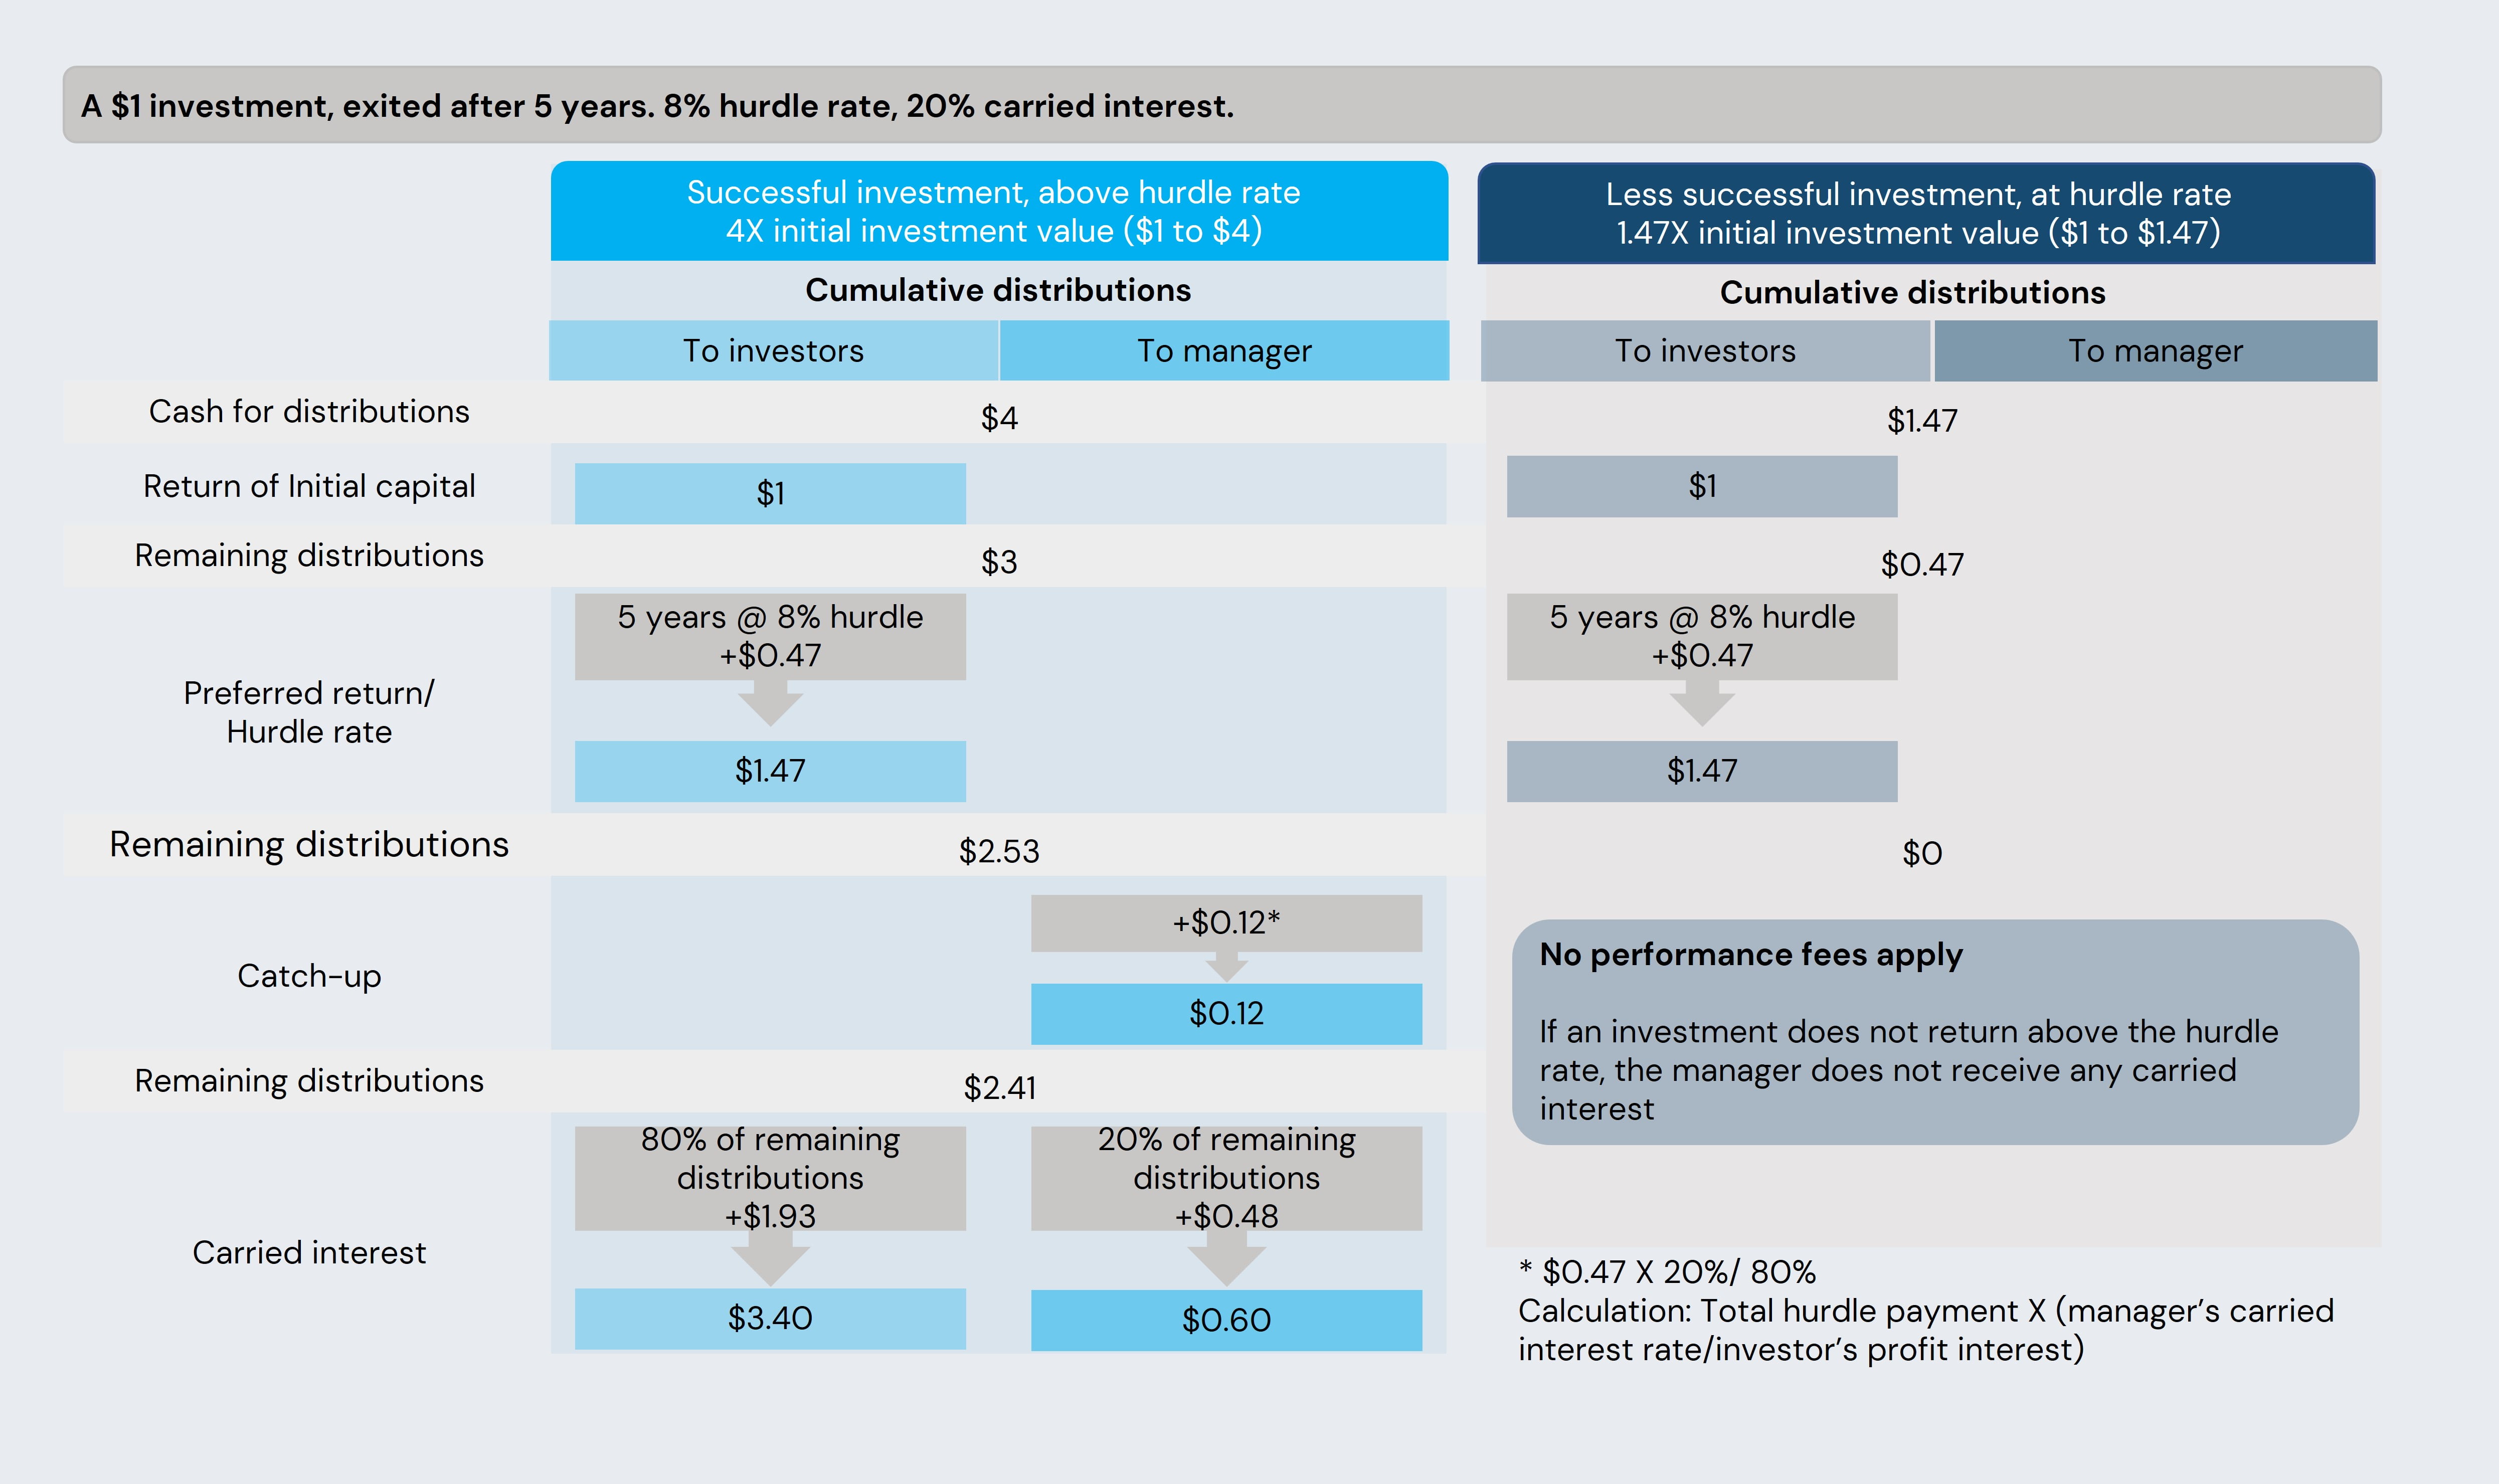
Source: HarbourVest, Family Capital. This is intended to be a purely illustrative example of how and when performance fees are applied in a private market fund. It does not include details of all fees that may apply when investing. It should be used solely as a guide and should not be relied upon to make investment decisions.
One can see how the performance fee incentivises the manager to generate a higher return, which ultimately can benefit the investor as well.
Conclusion:
In conclusion, investing in private market funds is a complex process and we recommend investors take their time to understand the cost implications when considering both the distribution and return of capital. For starters, LPs should largely view their investments as illiquid as GPs quite simply need sufficient time to fully execute their value creation plans. Indeed, the ‘J-Curve’ further highlights that investors should be aware that early cash flows in the fund lifecycle tend to be negative. For those investors looking for more liquid investment options offering regular access to capital throughout the fund cycle, we suggest reading our next article which will focus on the increasingly popular interval funds.
However, even taking into account the various fees involved in private market funds, this asset class has demonstrated over decades of varying economic climates that it outperforms public market equivalents and, in our view, should be considered by investors seeking leading returns on capital invested.
Please note that while the above concepts can be applied to private markets in general, the figures presented in this paper are specifically for private equity and returns would be expected to vary for other private market asset classes.
Sources:
- McKinsey Global, Private Markets Review 2021, April 2021. Past performance does not guarantee future returns.
- HarbourVest, Fundamentals: Simple answers to complex questions “How do Private Market Fund Fees Work?”, August 2020.
- HarbourVest, Fundamentals: Simple answers to complex questions “What are Cash Flows Like for Private Market Funds?”, August 2020.
- HarbourVest, Fundamentals: Simple answers to complex questions “How do Private Market Fund Fees Work?”, August 2020.
- HarbourVest, Fundamentals: Simple answers to complex questions “How do Private Market Fund Fees Work?”, August 2020.
Risk warning: Investment is restricted to professional, high-net-worth and sophisticated investors who can demonstrate that they have sufficient knowledge and experience to understand the risks of investing. Risks include the potential loss of capital and limited liquidity. Investments are long term and it may not be possible to sell your investment prior to maturity. Past returns are not a reliable indicator of future performance.
Disclaimer: All Rights Reserved. No part of this publication may be reproduced, stored in a retrieval system or transmitted in any form by any means, electronic, mechanical, photocopying, recording or otherwise, without the prior permission of the publisher, Bite Investments. The facts of this white paper are believed to be correct at the time of publication but cannot be guaranteed. Please note that the findings, conclusions and recommendations that Bite Investments delivers are based on information gathered in good faith from both primary and secondary sources, whose accuracy we are not always in a position to guarantee. As such, Bite Investments, can accept no liability whatsoever for actions taken based on any information that may subsequently prove to be incorrect.
This document has been prepared purely for information purposes, and nothing in this report should be construed as an offer, or the solicitation of an offer, to buy or sell any security, product, service or investment.